Benchmark tracking certainty of funds
In the decision of which funds to invest in, an important parameter is how well the fund can track the benchmark index. It is to be expected that the variance of how well a specific fund can track an index does not go to zero even if we had infinite data. As a simple model, the tracking of the benchmark could be modelled as a Gaussian distribution.
\[P(x) = \frac{1}{\sigma\sqrt{2\pi}}\exp\left(-\frac{1}{2}\left(\frac{x-\mu}{\sigma}\right)^2\right)\]This gives two free parameters. The mean value, \(\mu\), is how close the fund tracks the benchmark on average. And the standard deviation, \(\sigma\), how much the tracking error deviates from the average tracking error. There is no theoretical background for assuming that the derivation from the benchmark should follow a Gaussian distribution. But in the absence of better the Gaussian distribution seems to be the usual choice.
The mean and standard deviation have been calculated for specific funds, see this Reddit post. These quantities are very easy to determine (without error bars). Now let us take this one step further, and give an estimate of the certainty of the mean and standard deviation, to find out if we can actually distinguish the performance of these specific funds.
The data from the Reddit post is the following:
| Year | DKIGI deviations | SPVIGAKL deviations | SPIEMIKL deviations |
|---|---|---|---|
| 2013 | -0.28 | - | - |
| 2014 | -0.28 | - | -0.94 |
| 2015 | -0.52 | - | -1.34 |
| 2016 | -0.42 | - | 2.37 |
| 2017 | -0.19 | - | -0.07 |
| 2018 | -0.20 | -0.54 | 0.16 |
| 2019 | -0.40 | 1.06 | 0.96 |
| 2020 | 0.34 | 1.01 | -2.02 |
| 2021 | -0.11 | -1.17 | 0.27 |
| 2022 | -0.82 | -0.07 | 2.63 |
In a previous post it was shown how to use Bayesian inference to get a likelihood distribution of the parameters. Now using Bayesian inference on the data represented above gives the following graphs.
For DKIGI
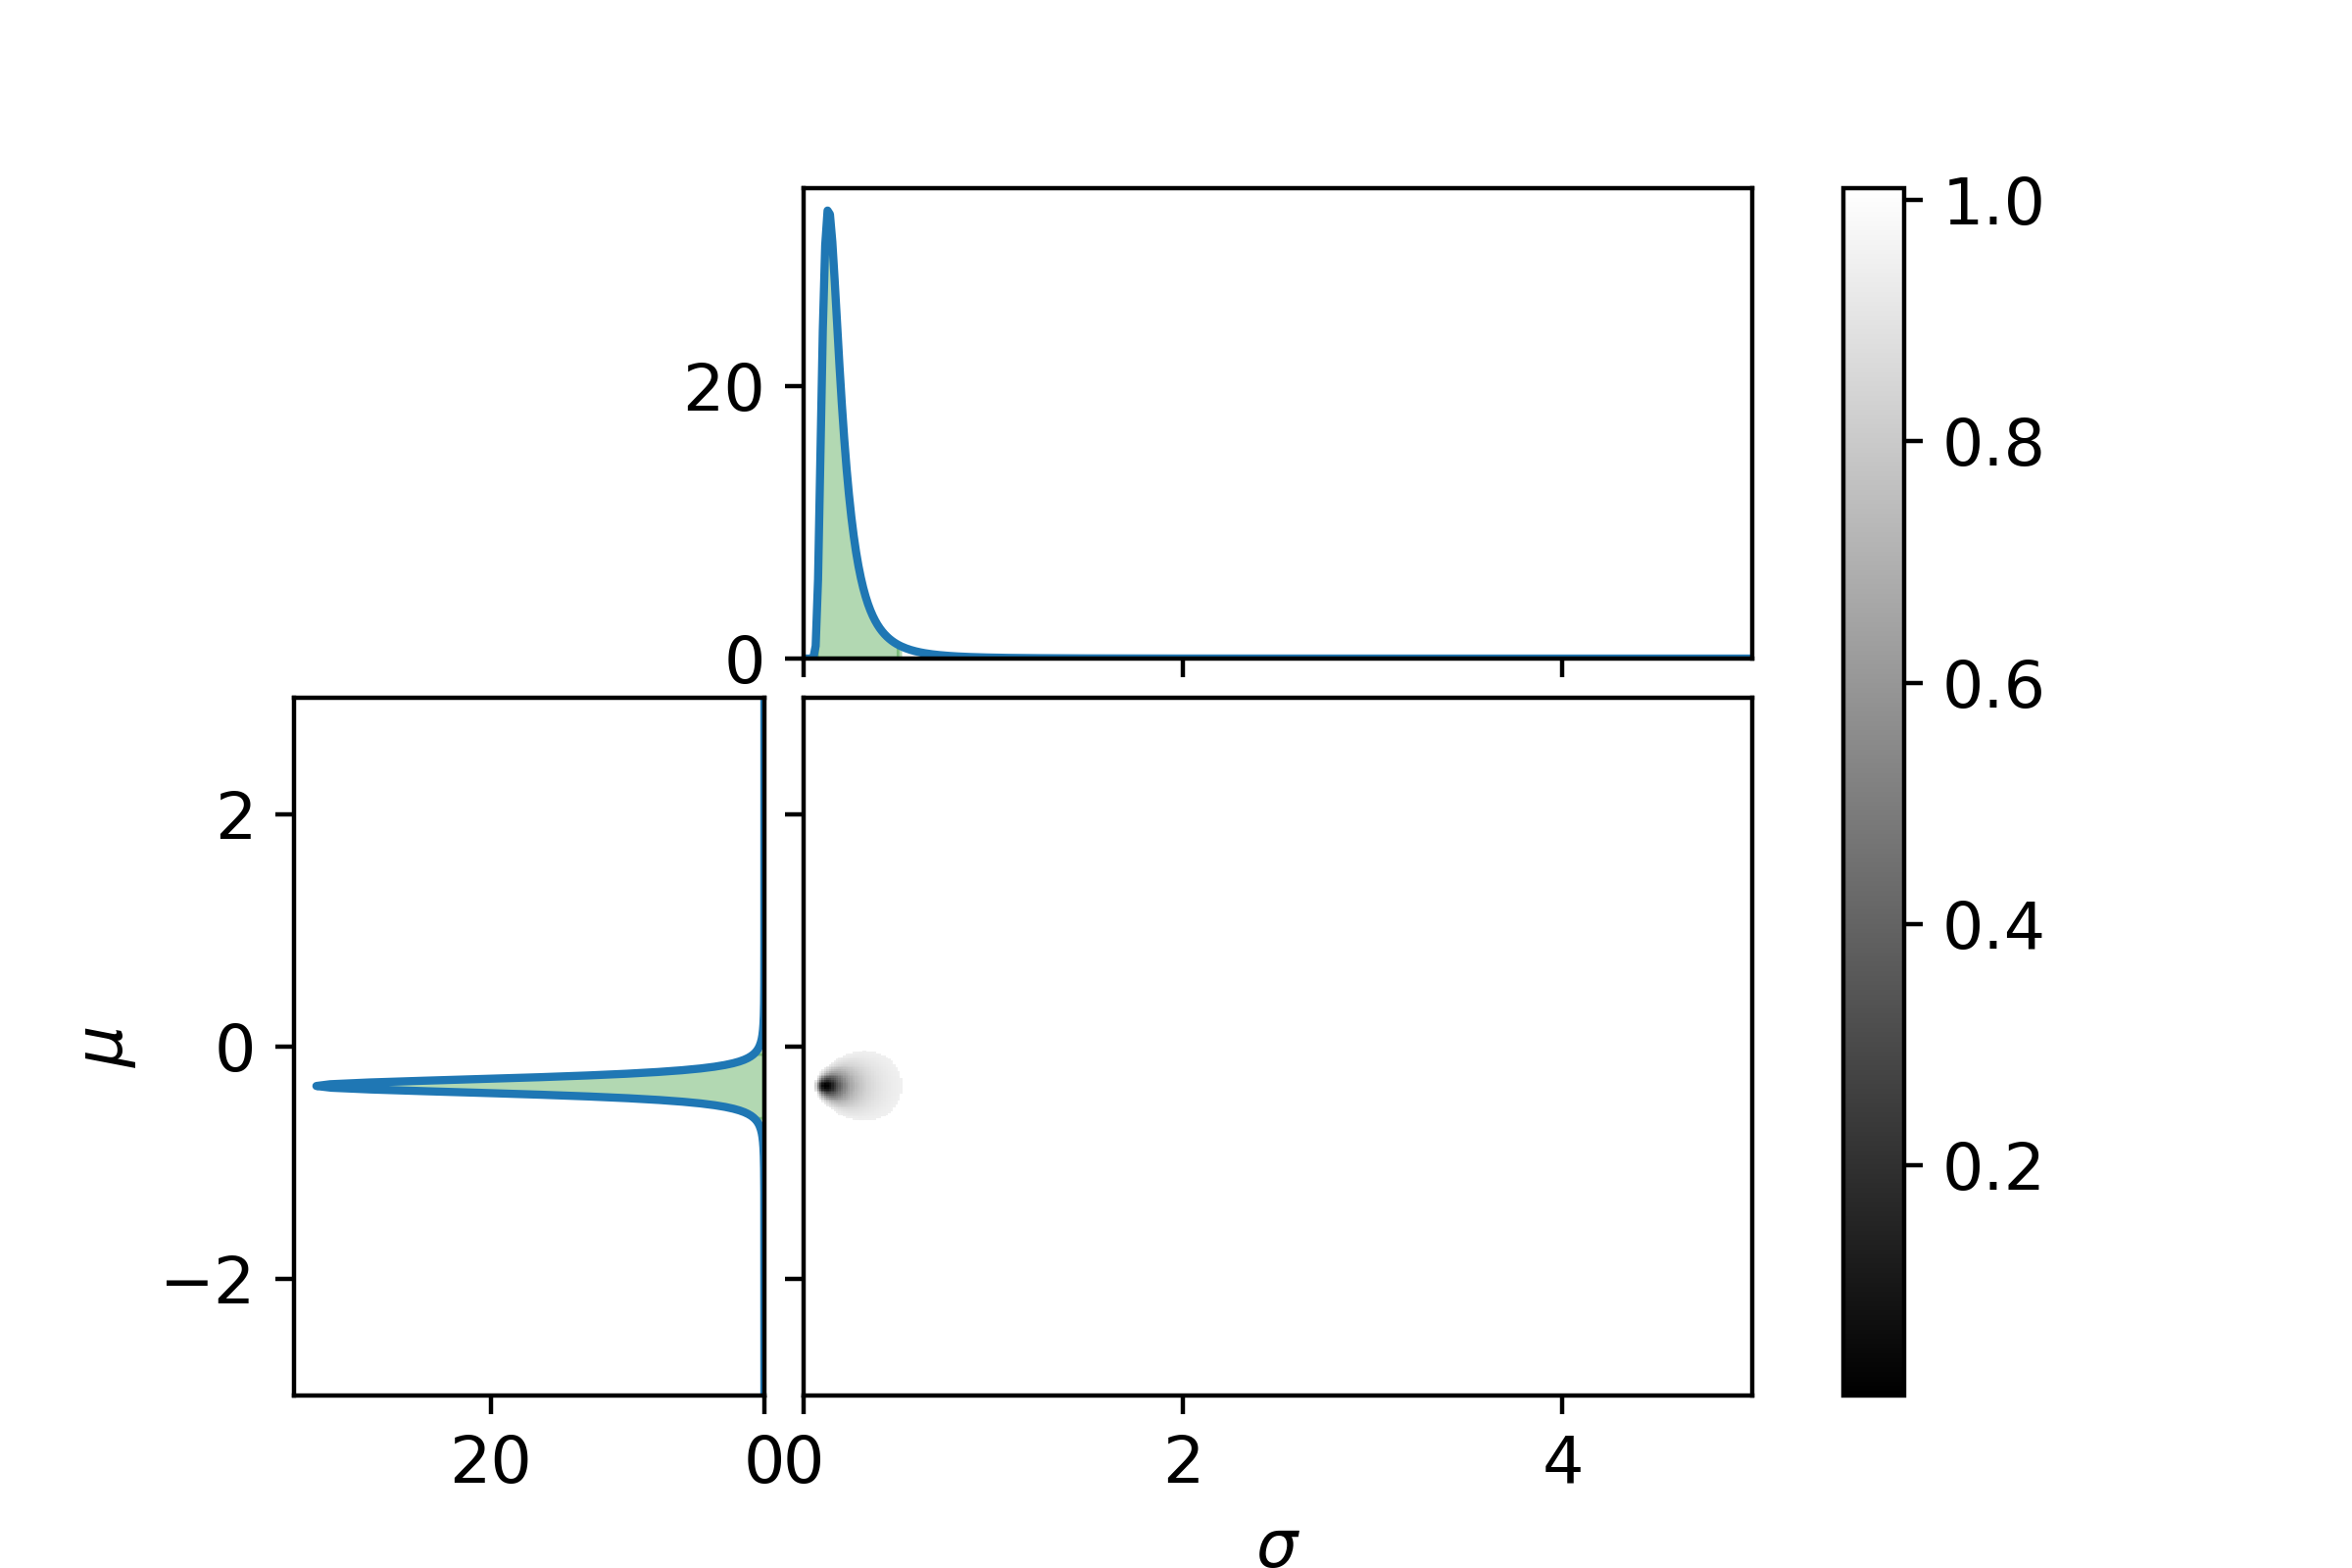
On the x-axis is the value of the standard deviation, and on the y-axis is the value of the mean value. The black to grey area in the central plot shows the 95% confidence region. The darker the color the more likely. The leftmost graph shows the distribution of the mean value, and the green area is the 95% confidence interval. The rightmost graph shows the distribution of the standard deviation with the green area being the 95% confidence interval. Now the graphs for the last two funds:
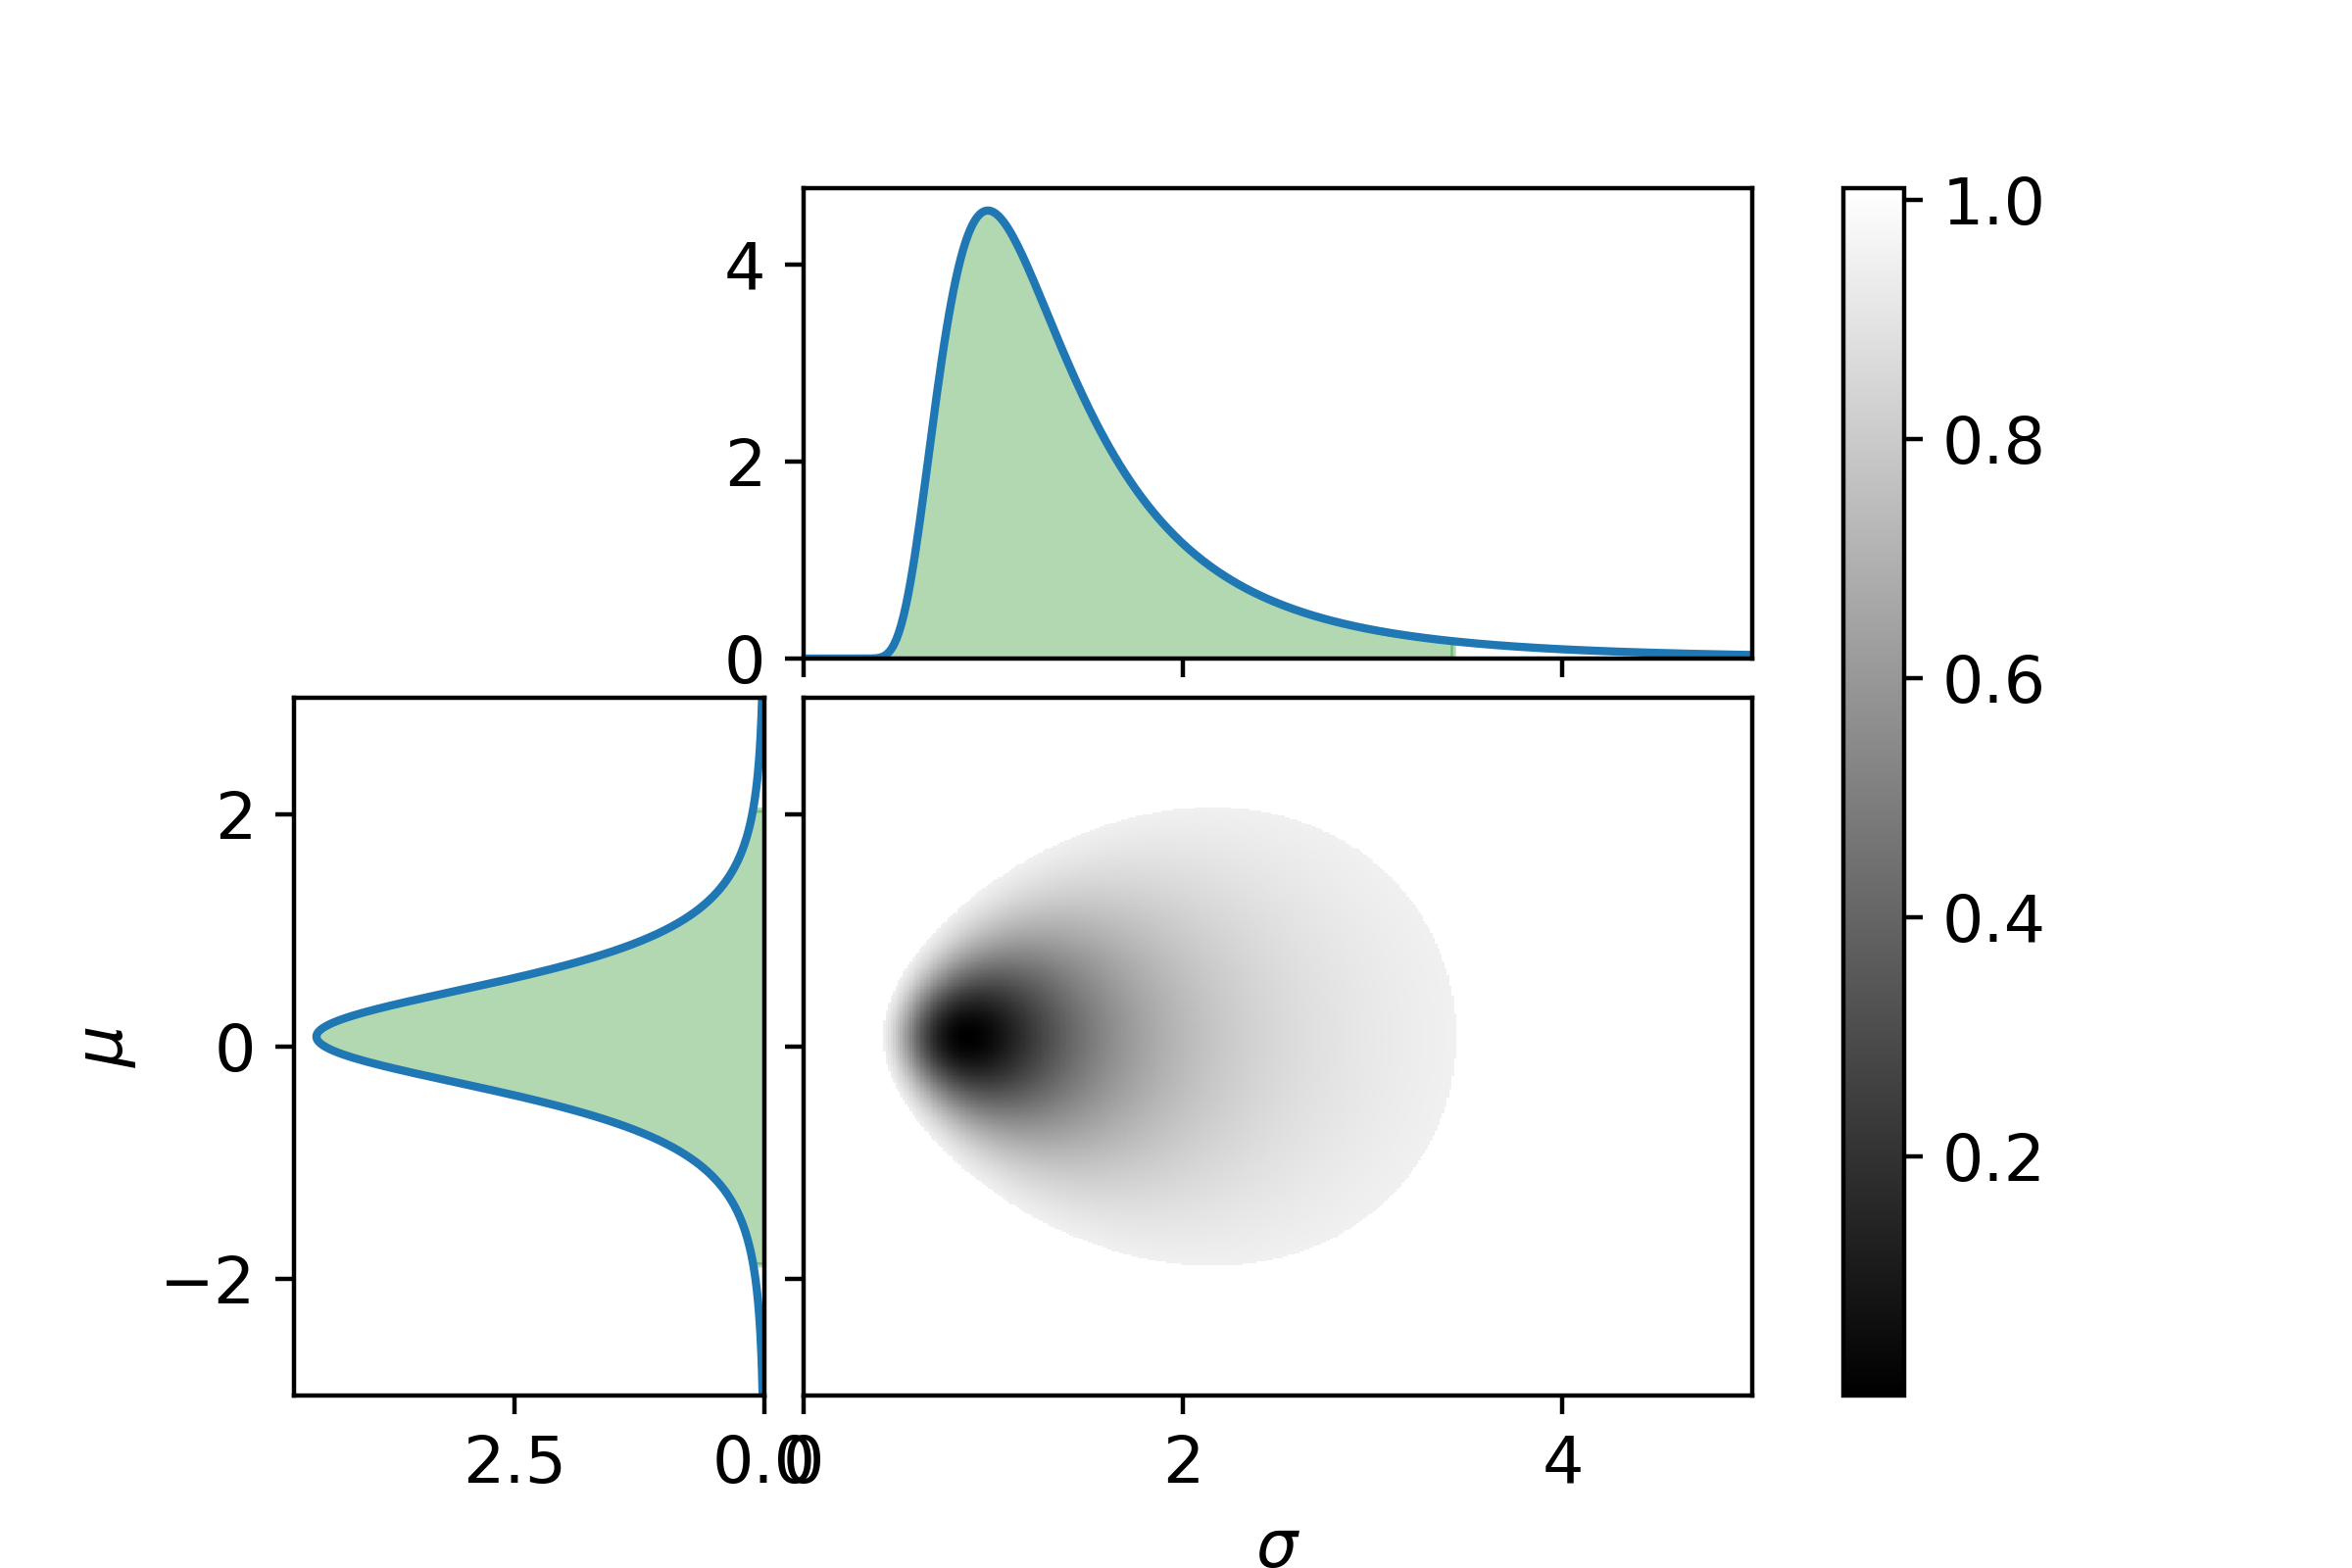
For SPVIGAKL
And lastly for SPIEMIKL
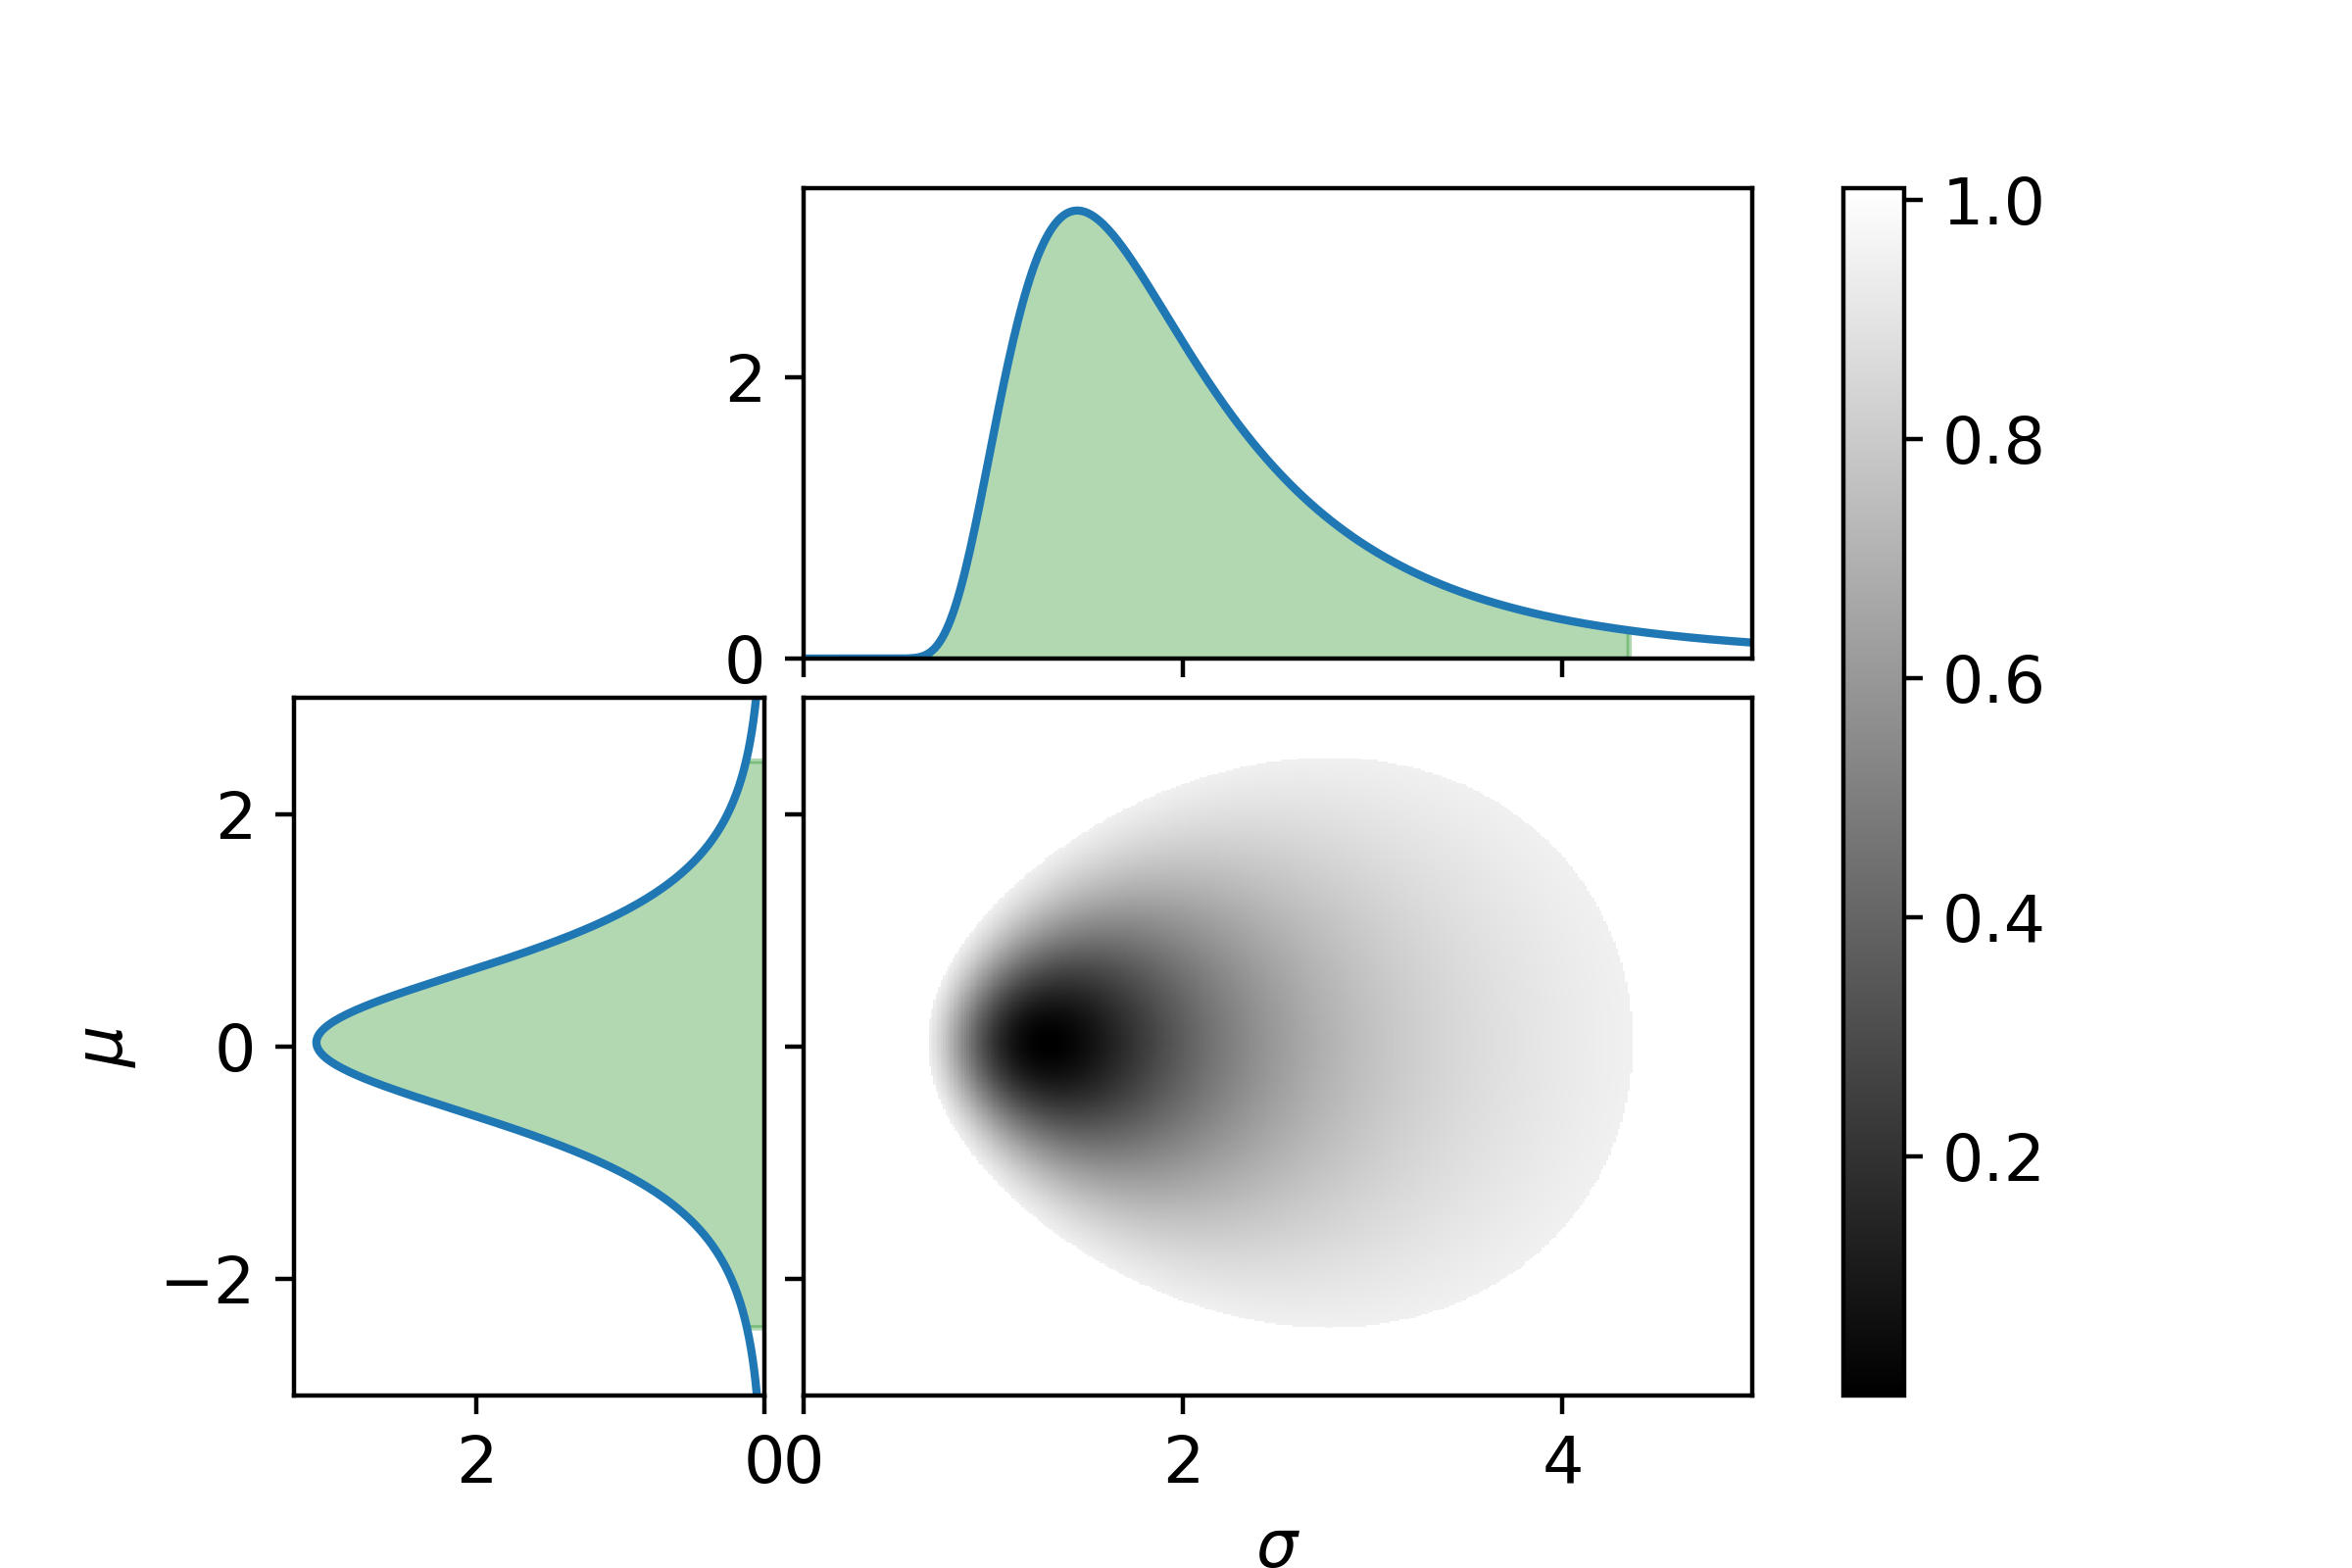
It can be seen that how well DKIGI follows the benchmark is much more determined than the other two. Now to make it easier to compare, let us look at the 95% confidence and the maximum likelihood for the mean values and standard deviations.
| DKIGI \(\mu_\mathrm{max\ likelihood}\in\{\mu_\mathrm{max},\ \mu_\mathrm{min}\}\) | SPVIGAKL \(\mu_\mathrm{max\ likelihood}\in\{\mu_\mathrm{max},\ \mu_\mathrm{min}\}\) | SPIEMIKL \(\mu_\mathrm{max\ likelihood}\in\{\mu_\mathrm{max},\ \mu_\mathrm{min}\}\) |
| \(-0.34 \in \{-0.04, -0.62\}\) | \(0.08 \in \{2.05,-1.87\}\) | \(0.04 \in \{2.47, -2.41\}\) |
| DKIGI \(\sigma_\mathrm{max\ likelihood}\in\{\sigma_\mathrm{max},\ \sigma_\mathrm{min}\}\) | SPVIGAKL \(\sigma_\mathrm{max\ likelihood}\in\{\sigma_\mathrm{max},\ \sigma_\mathrm{min}\}\) | SPIEMIKL \(\sigma_\mathrm{max\ likelihood}\in\{\sigma_\mathrm{max},\ \sigma_\mathrm{min}\}\) |
| \(0.11 \in \{0.51, 0.06\}\) | \(0.87 \in \{3.43,0.43\}\) | \(1.29 \in \{4.36, 0.67\}\) |
Tabulating the data loses the information on the exact shape of the confidence region, but as long as that is kept in mind it is not a problem for the interpretation. DKIGI is the fund with the most determined parameters (confidence region is the smallest), which is intuitively expected because it has more data points (10 data points). However, SPIEMIKL has almost the same amount of data points (9 data points) and is very undetermined in what the average deviation is from the benchmark. The 95% confidence interval ranges from 2.47 to -2.41. SPVIGAKL is also very undetermined, but this fund is a lot younger (only 5 data points).
It is very hard to conclude which of these three funds has the lowest tracking error. The average tracking error of both DKIGI and SPVIGAKL is completely contained inside the confidence interval of SPIEMIKL.
The strongest conclusion that can be made is that DKIGI is much more consistent in its tracking error, the standard deviation is much more determined, and almost entirely outside the confidence interval of the standard deviation of both SPVIGAKL and SPIEMIKL.
It should be noted that the deviation from the benchmark from DKIGI is very close to the running costs of the fund, 0.4% yearly.
As a retail investor, it is very hard to compare the benchmark tracking errors of different funds. Doing a simple average of the historical tracking error can often be very misleading because the average tracking can have a very large 95% confidence interval (this information is completely lost in a simple average).
If you enjoyed this post you can donate a coffee , if you like :)